 Dolenjska cesta 83, 1000 Ljubljana, Slovenia


Bigger changes:
Subscriptions overhaul:
Additional way to display system subscription status. On all system pages in the top navigation bar, it colors and displays accordingly if the system subscription is expired, invalid or disabled. Clicking on the status button opens a modal window with additional information for the user.
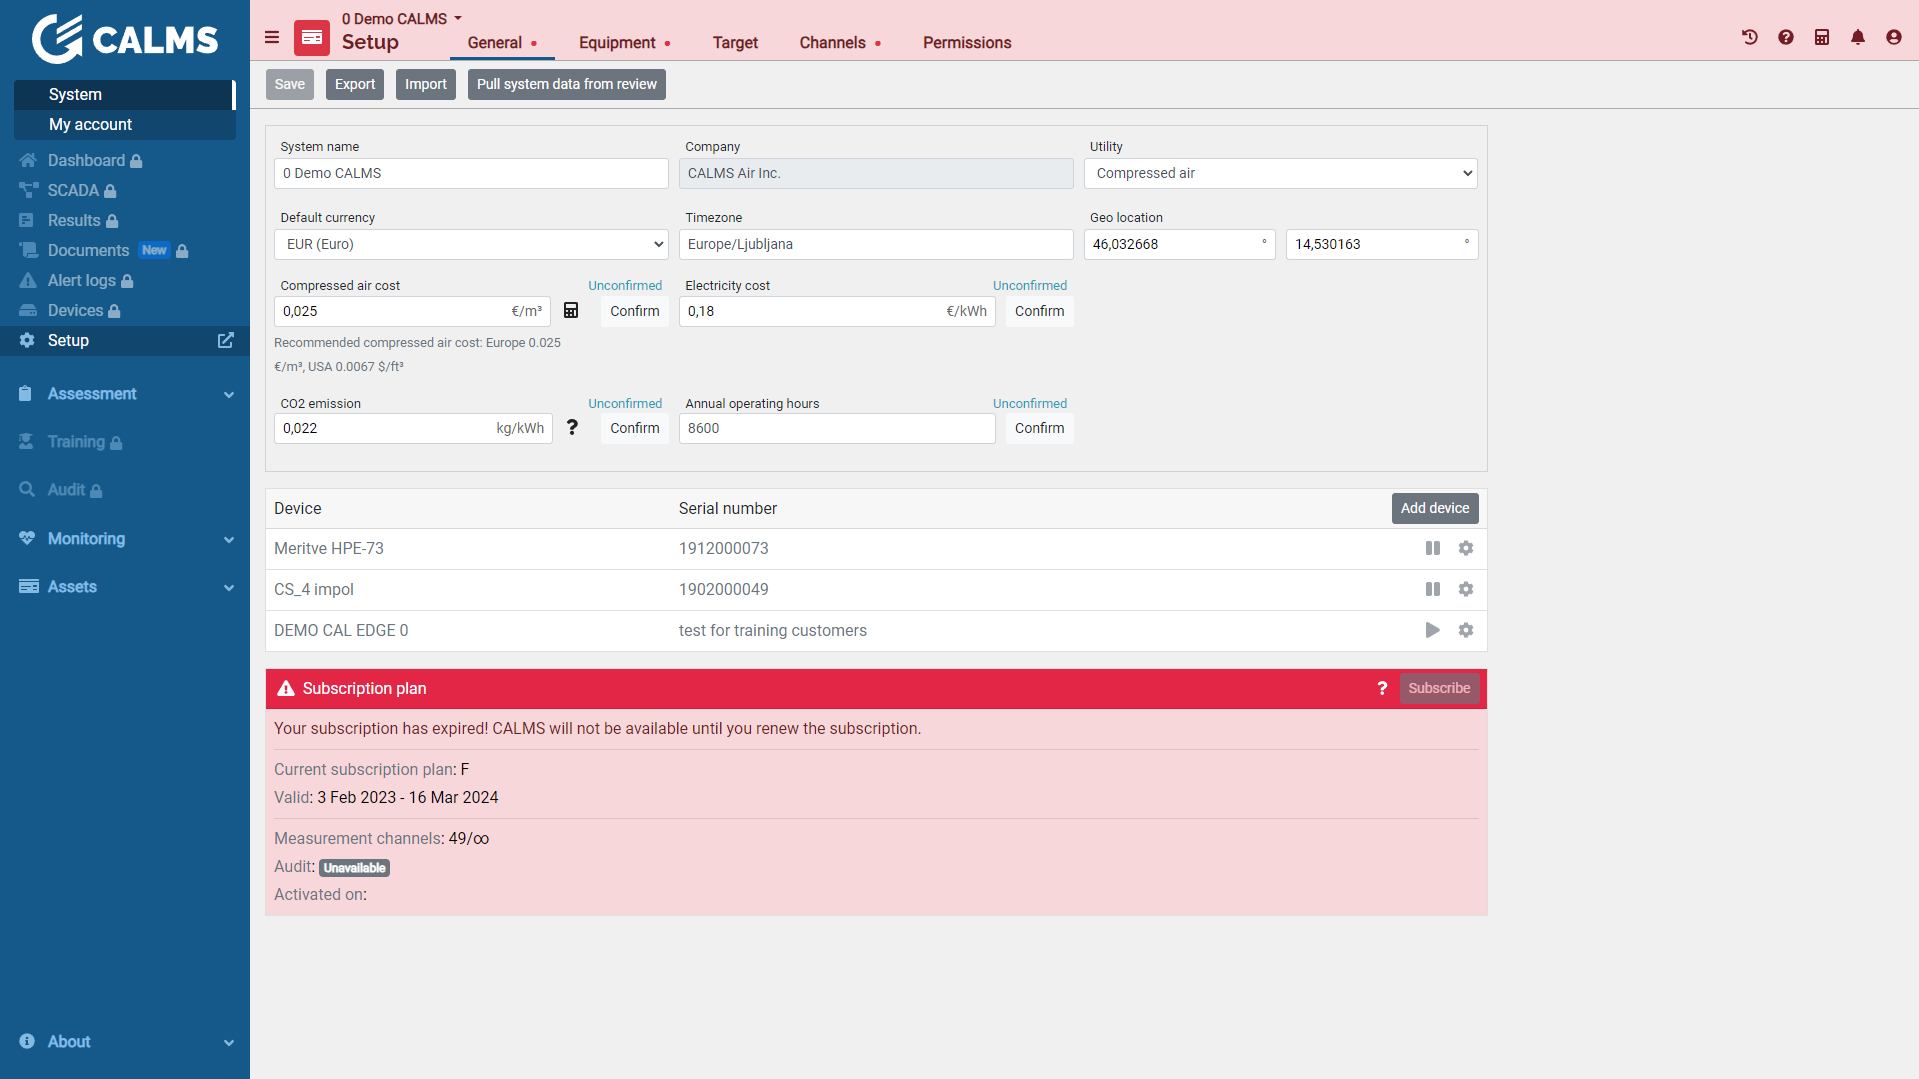
Once the system switches to an invalid subscription plan (if it has more measurement channels than the subscription package allows), the system manager needs to fix it as soon as possible. If the situation has not been resolved in time, the system is locked similarly to when it is expired or disabled.
Improved notification/email text when the system is soon to be expired, expired or invalid.
Improved descriptions of subscription packages.
New CALMS Experts platform:
- Added a new page on our website https://www.calms.com/experts where people in need of optimizing their compressed air operations, can connect with compressed air experts all around the world.
- Added a button that leads to a form where you can apply to be featured on the website.
Changes for adding sensors:
- Improved the process of adding sensors to the diagram. When a sensor is added to the diagram, the model sensor selection is now immediately available (also this list has been improved to make standard sensors easier to find).
- Option to add a “dummy sensor” to the diagram. When the sensor is added to the scheme, the modal windows have the option “Skip and setup later”. This means that the sensor icon will be added normally to the scheme and we can fully configure the sensor later.
Reports overhaul:
- Improved visuals of the reports.
- Simplified reports sections.
- Added an option to add a contact and a phone number of the technician in the report section.
- Many bug fixes.
- Added documentation.
New graphs:
Added new Duration graph on the Analysis tab and functionalities for experts.
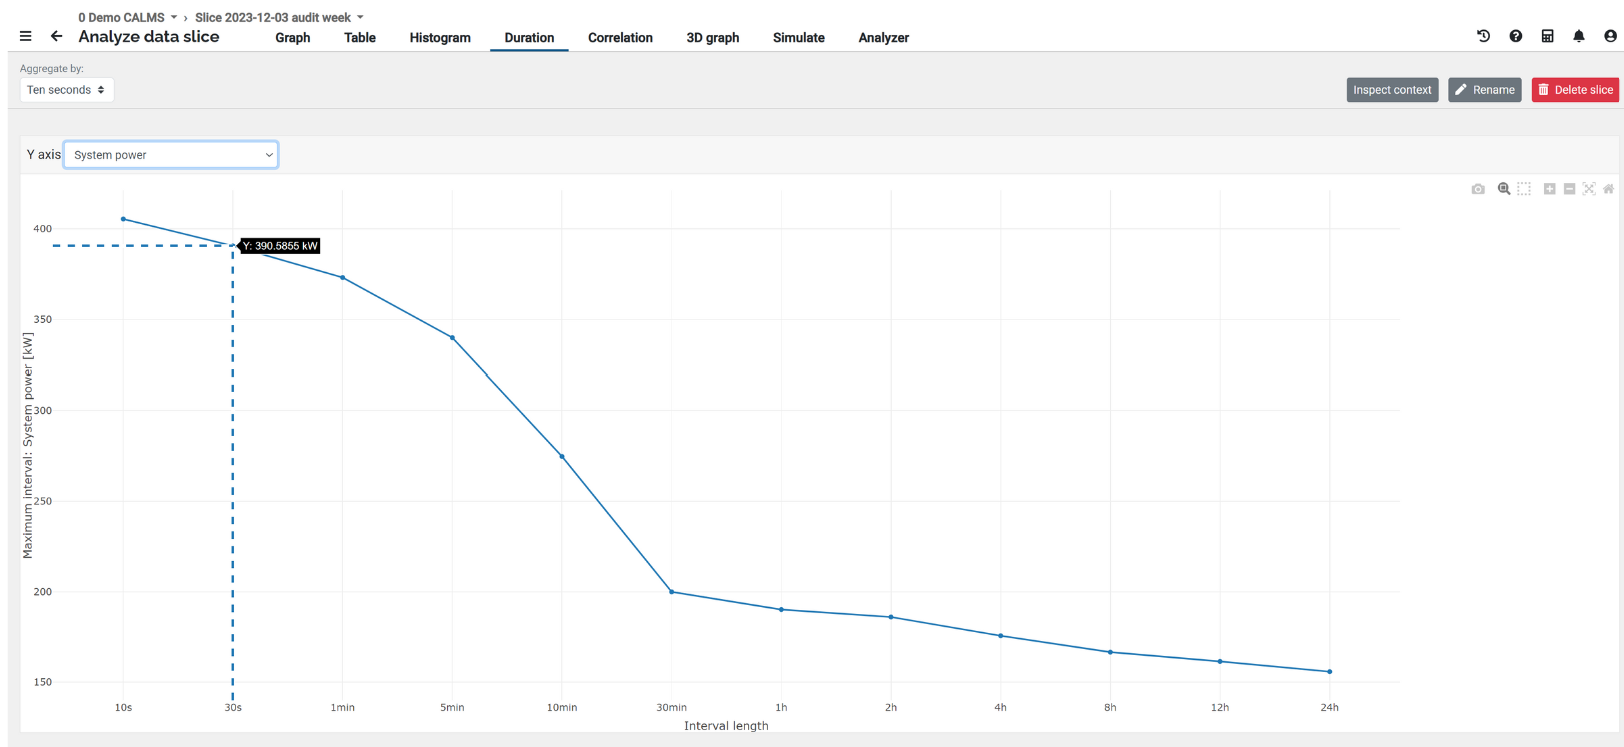
You can read more about it in the documentation: threshold curve, duration curve
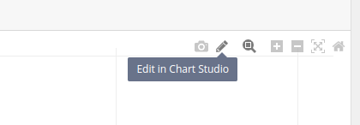
Added a new feature that allows you to open graphs in Chart Studio. Here, you can export graphs and data, refine values, and enhance the graph’s appearance for reports.
Annotations on the monitoring inspect page/graphs:
- Added annotations on the inspect page.
- Current annotations have been improved and are now clearer and more useful.
- New Annotations view has been added to the side of the graph, showing a list (ordered by time) of all annotations in the currently selected period. The list can be filtered by annotation type. Clicking on an annotation from the list moves the period on the graph to be in the range of the selected annotation. It is also possible to download the whole list of annotations in the selected period. You can read more about it in the documentation: annotation tool, annotation card.
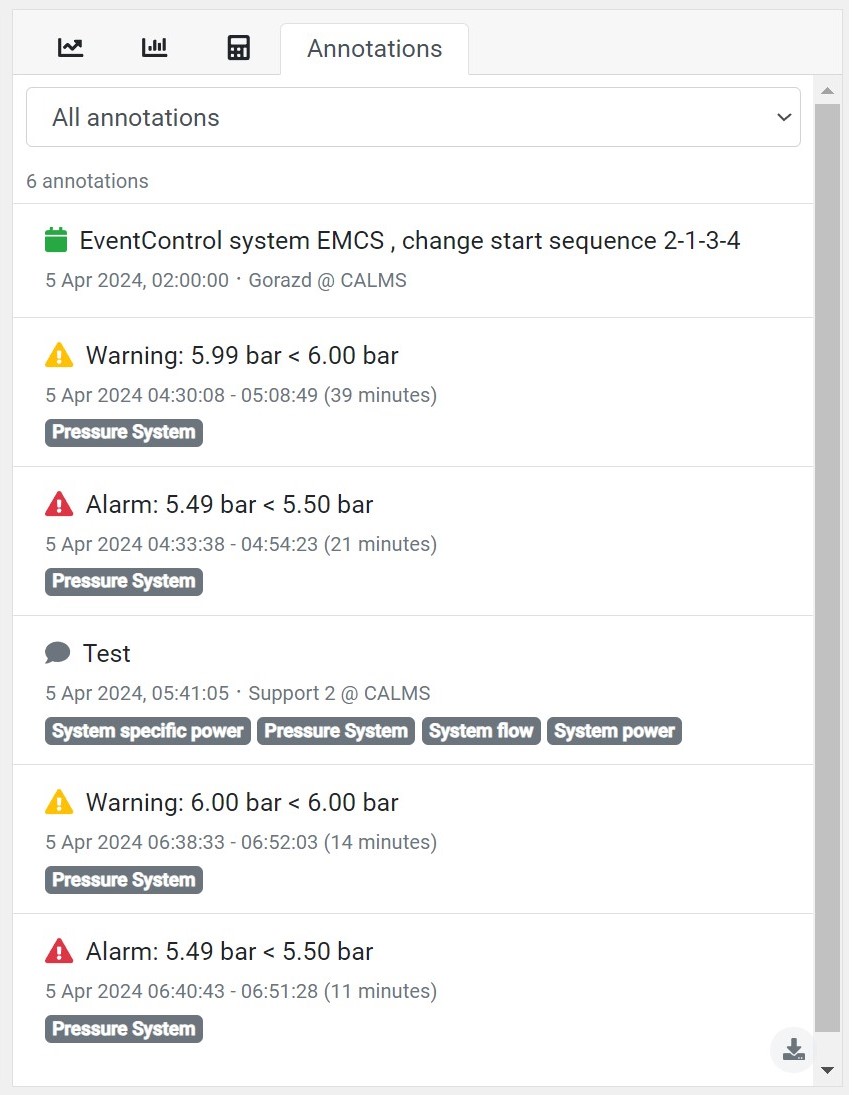
Annotation card shows all annotations, sorted by time of annotation and (optionally) filtered by type of annotation.
Annotations on the result page/graphs:
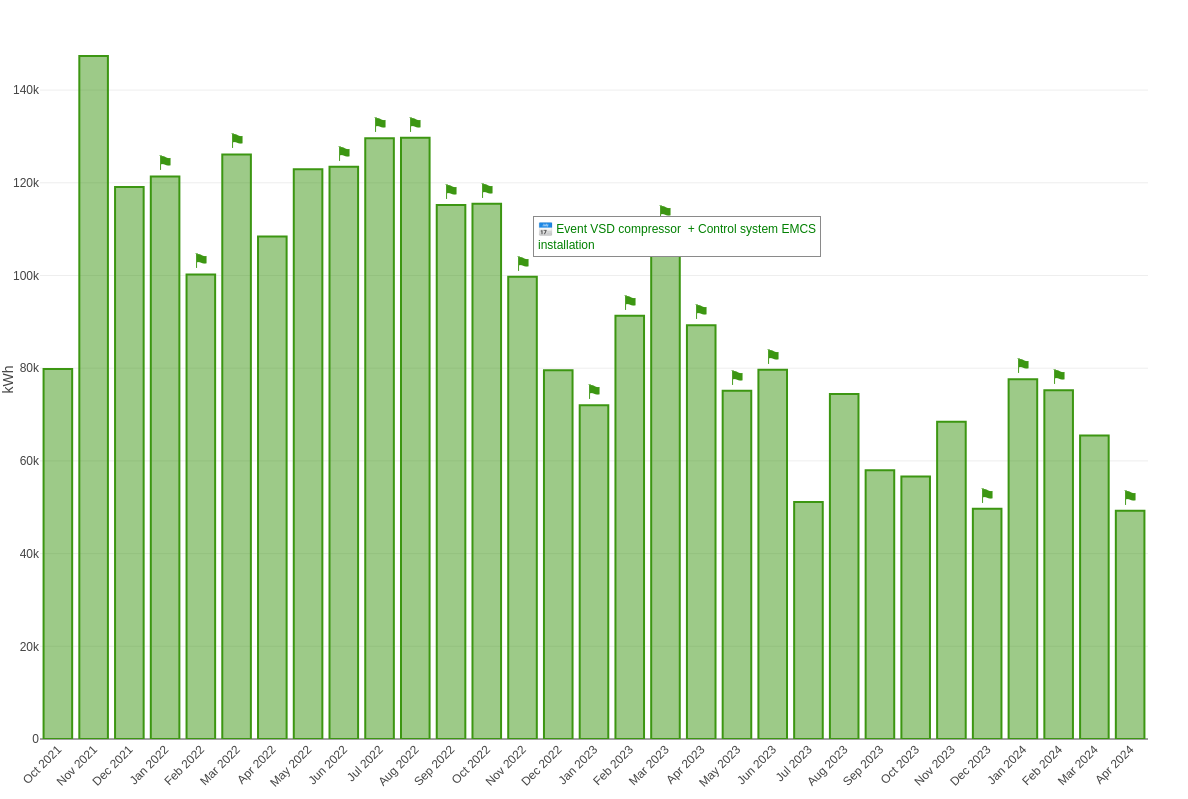
- The results graph takes the same annotations from the aforementioned monitoring page, but only displays comment and event annotation types. These annotations are displayed directly on the plot above each data point (vertical bar plot). By default, a flag icon (⚑) is used to indicate that the data point includes some type of annotation. You can show/hide a more detailed view of the annotations by clicking on the respective data point.
Smaller changes:
New option for filtering permanent systems from the list (for managers and admins).
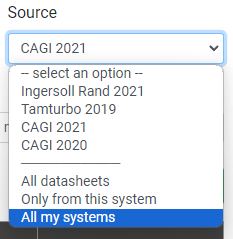
You can now filter compressor sources from All systems, when filling compressor data.
French & Slovenian translations updates.
Fixed a bug when saving simulations.
Improved loading time of items and their images on SCADA and Setup Equipment.
Added an option to import waste audits from Prosaris camera application.
Images are now hidden from SCADA standard view and PI&D scheme which shows up in reports and on system dashboard.
