 Dolenjska cesta 83, 1000 Ljubljana, Slovenia


Most recently added features of the CALMS Application:
MONITORING - Enhanced Graph Measurement Tool
Effortlessly measure distances between two or three points on a graph to ascertain time and value differences. Initiate this by hovering your mouse over the graph and pressing “1”, “2” or “3” to drop markers at the cursor’s location. To reset, simply hit the “Esc” key. Plus, when you download the graph image, your measurements are conveniently included, providing a comprehensive visual analysis tool. Just click in the graph area to activate and start measuring with ease.
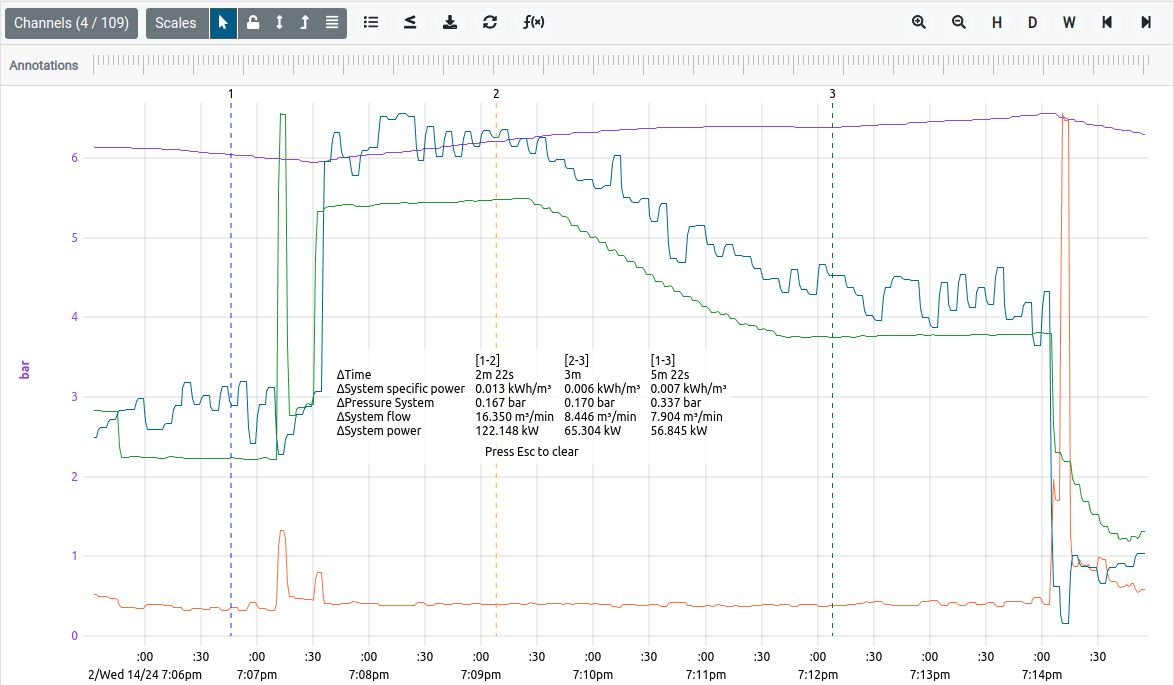
How to measure distance on a graph:
Step 1: Point your mouse at the first desired point.
Step 2: Press 1 on keyboard.
Step 3: Point your mouse at the second desired point.
Step 4: Press 2 on keyboard.
Step 5: Measure the data in-between.
Benefits include:
- Easily initiate measurements and place markers.
- Measurements are automatically included in the exported graph image.
- User-friendly design for easier measurements.
For more details check out the documentation page: https://docs.calms.com/manuals/web-application/systems/monitoring/
SCADA - Custom Equipment Images
We’ve introduced a practical update to our SCADA system: the ability to replace traditional equipment symbols with real images of your equipment in the P&ID views. This feature aims to provide a more realistic representation of your plant’s layout, enhancing the clarity and accuracy of your SCADA interface.
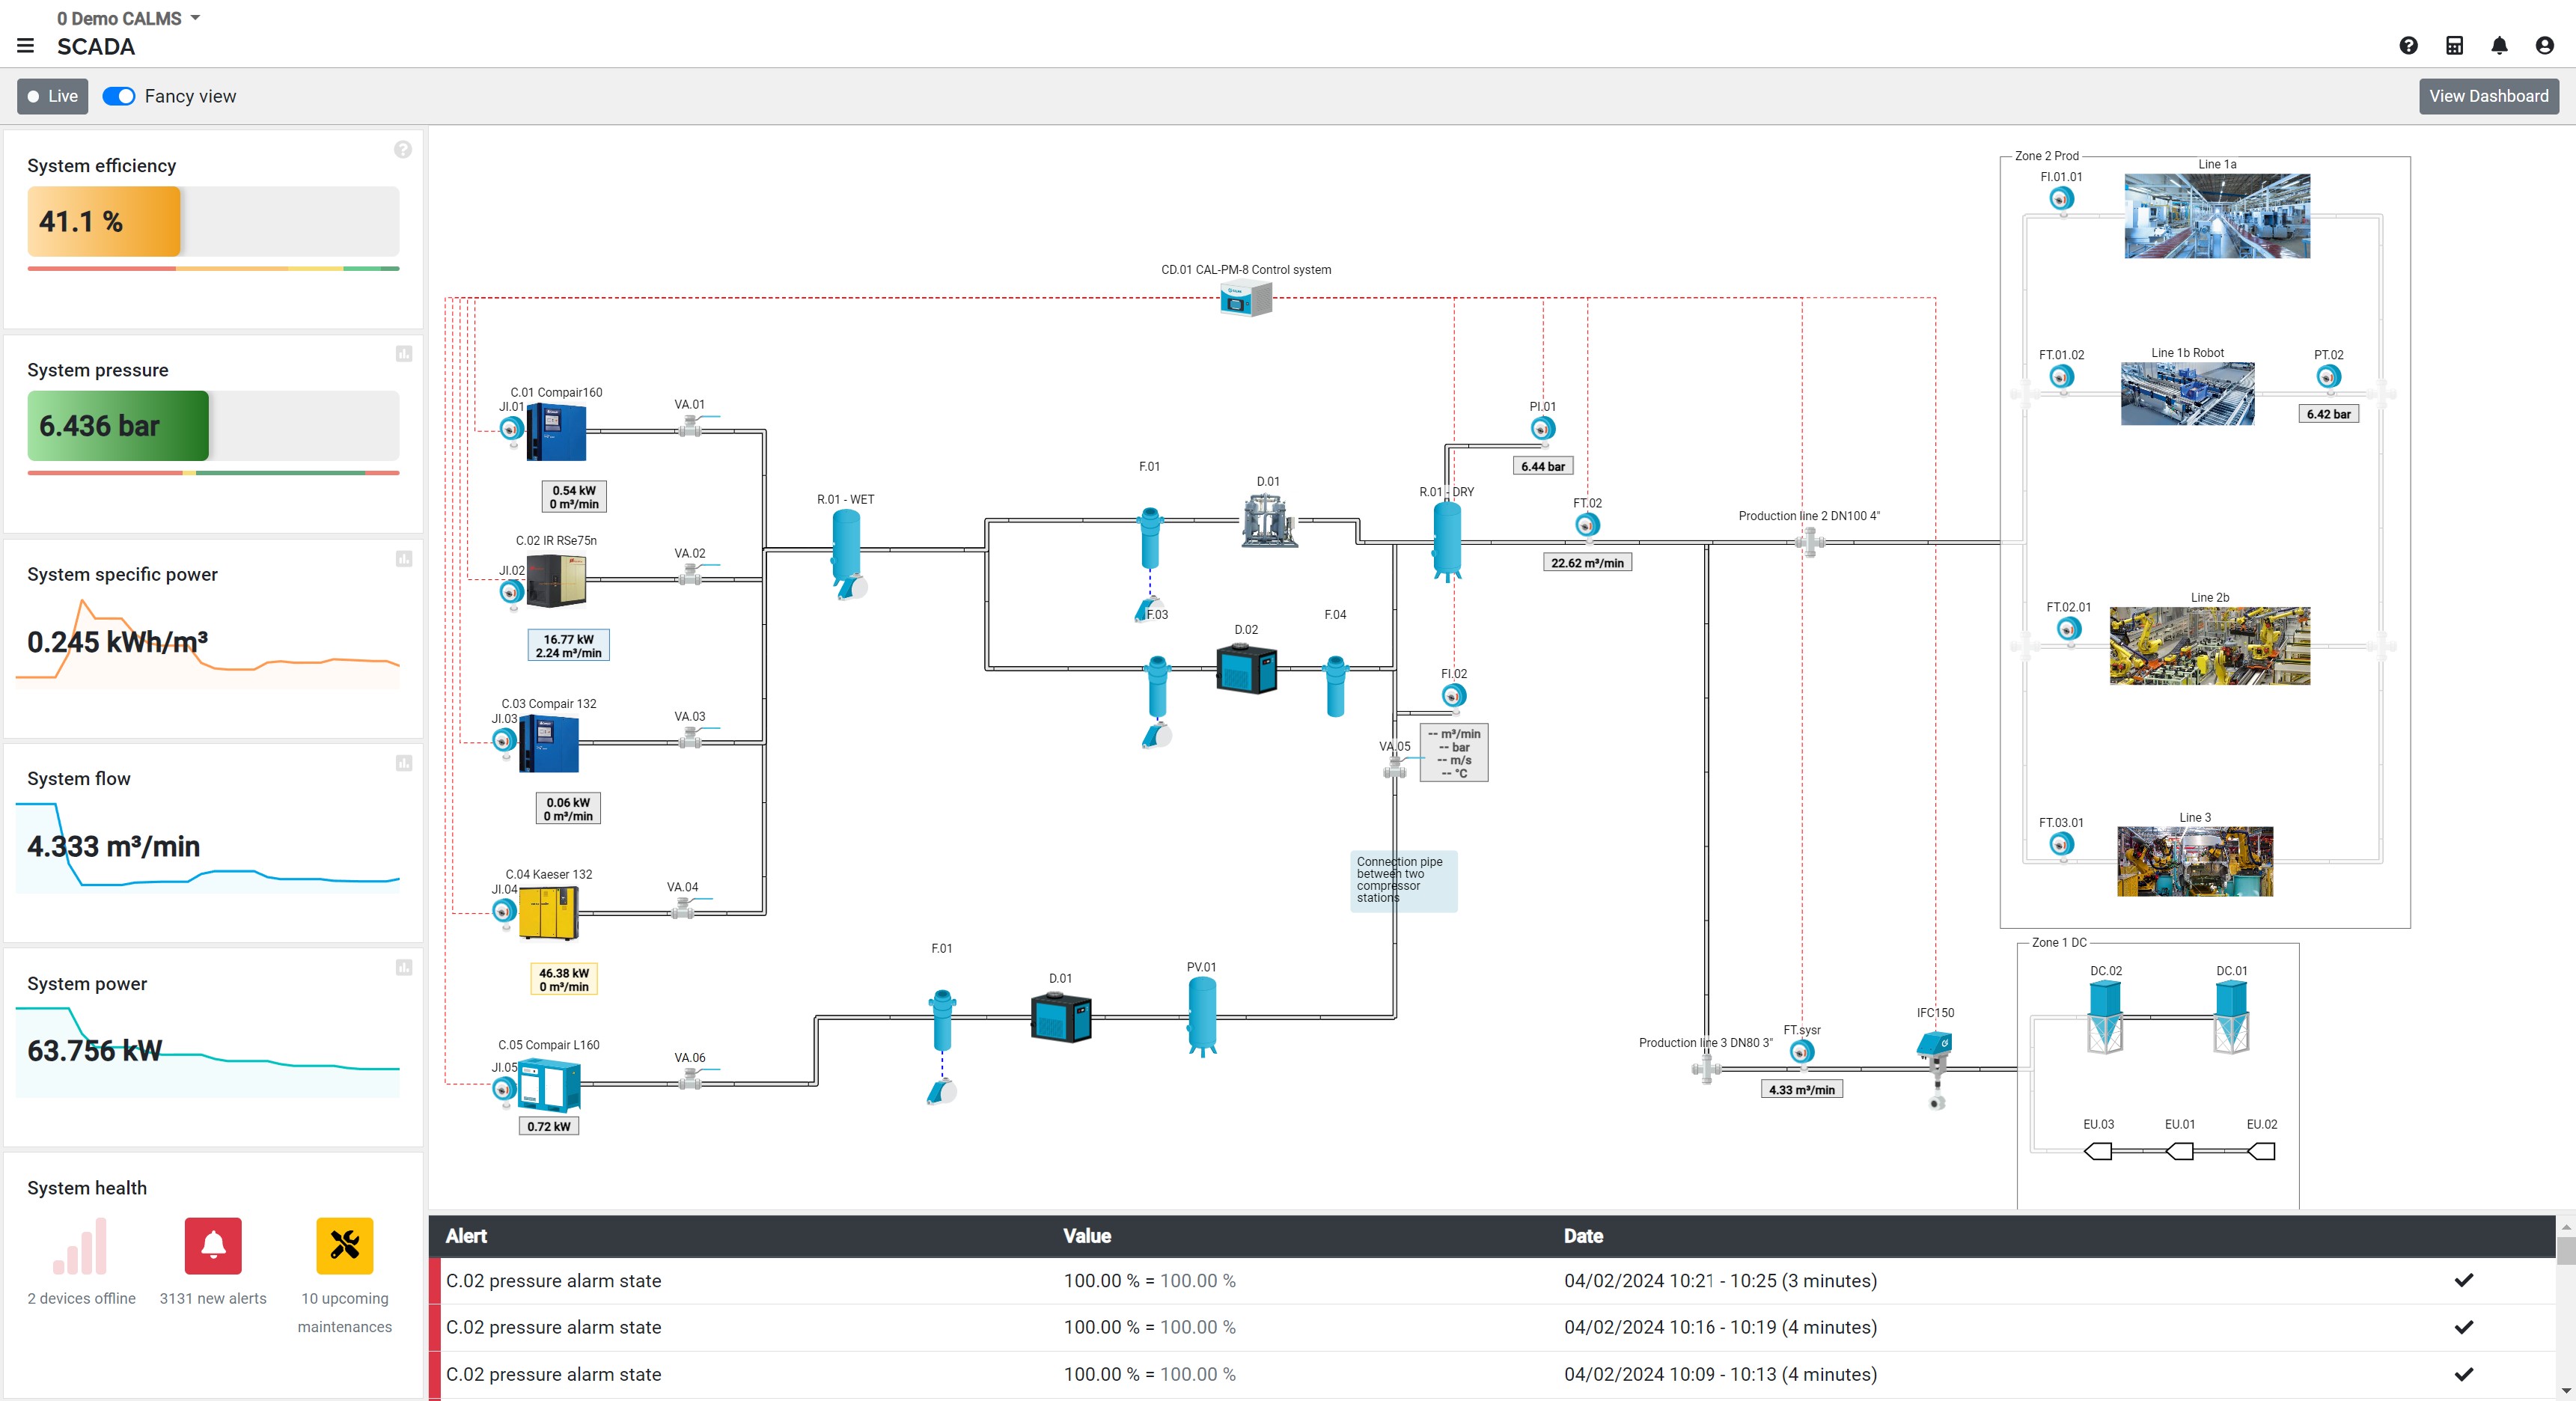
How to add a real image of your equipment:
Step 1: Click on the compressor that you want to change the image.
Step 2: Upload the image of the compressor.
Benefits include:
- Improved clarity by using actual equipment images for easier identification.
- Simplified interface for more intuitive navigation and monitoring.
- Efficient setup process allowing for quick updates to your SCADA displays.
- This update is designed to make your SCADA system more user-friendly and aligned with the real-world setup of your operations.
For more details check out the documentation page: https://docs.calms.com/manuals/web-application/systems/scada/
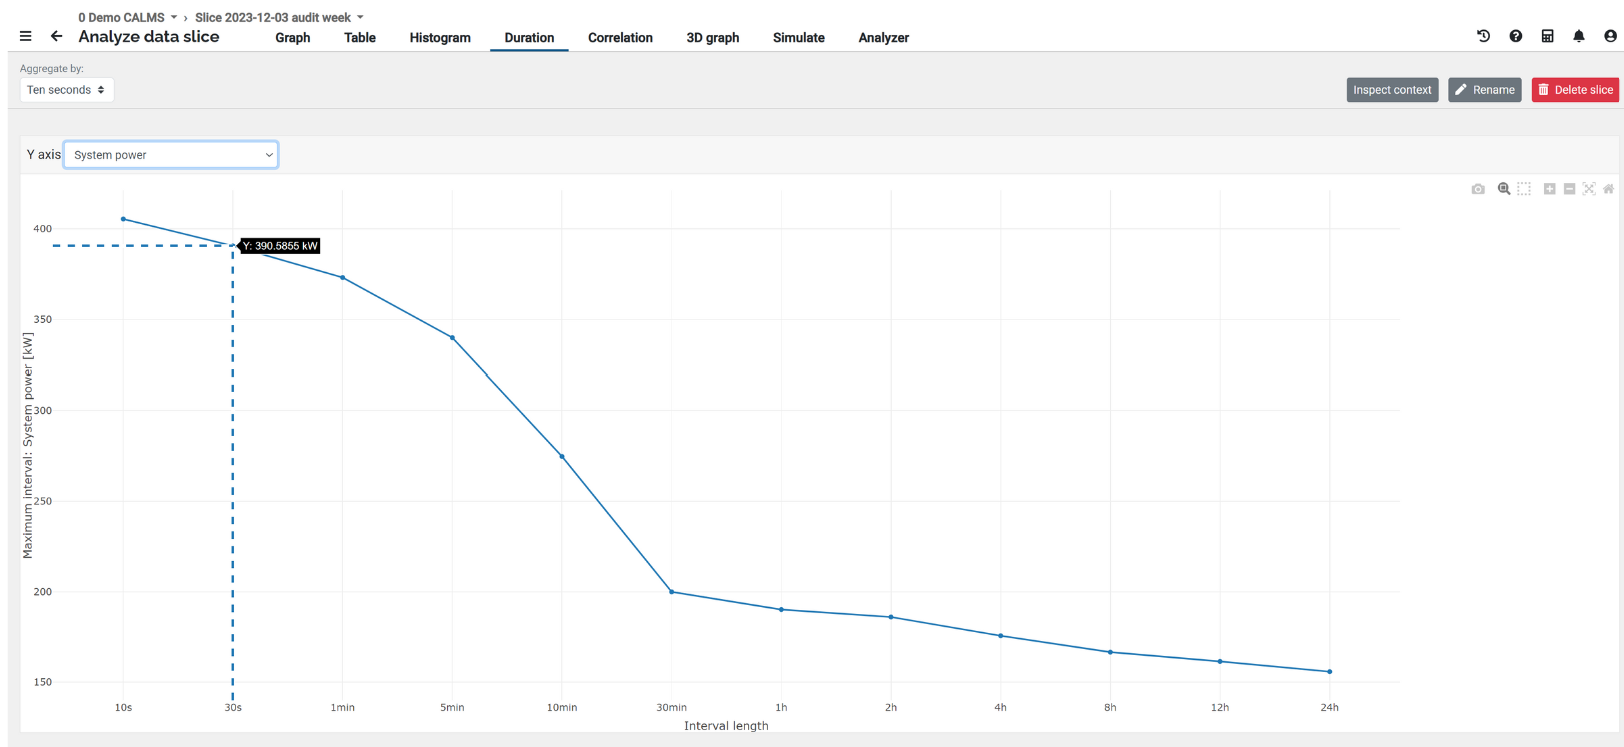
Analyze page - New Graph for Duration
The Load Duration Curve in CALMS is a critical tool for visualizing peak values of parameters like power across various time frames. It plots the maximum channel values against specified time intervals, offering a clear picture of usage patterns. This feature not only allows you to spot the peaks within a reporting period but also lets you compare them against the highest values recorded over the system’s entire lifetime. It’s particularly useful for establishing realistic targets in control algorithms related to power, flow, or pressure. By utilizing this curve, optimizing control settings becomes a more data-driven and efficient process.
Benefits of the newly added Duration graph:
- Provides a snapshot of the maximum channel value (e.g., Power) utilized over specific time intervals.
- CALMS searches within the reporting period to identify peak values across various time frames.
- Allows comparison with the highest-ever values for a particular system over different time intervals, using a background curve that contrasts the system’s lifetime data against the reporting period.
- Useful for establishing power/flow/pressure-based targets in control algorithms, enabling the setting of realistic setpoints and optimization targets.
- Offers the flexibility to choose response rates: use a higher aggregate (like 10min) for faster responses or a lower aggregate (like 10sec) for more detailed, slower responses.
For more details check out the documentation page: https://docs.calms.com/manuals/web-application/systems/monitoring/#duration
